Clean, visualized data in minutes
columnly.io is a do-it-all data cleaning tool. Upload a file, set code-free cleaning rules, and export a clean file and chart. All in one place.
Hours of cleanup, done in a few clicks.
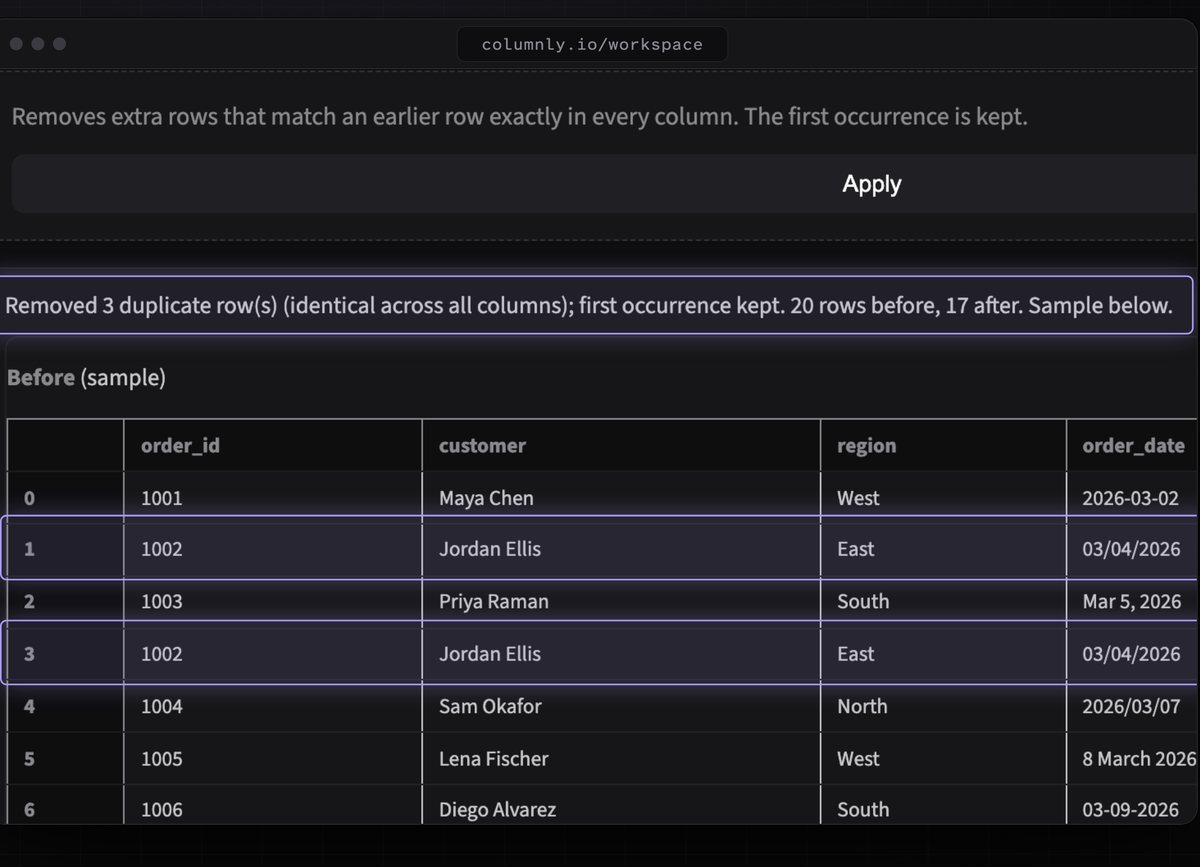
Remove duplicates
Find rows repeated across every column and drop them, keeping the first.
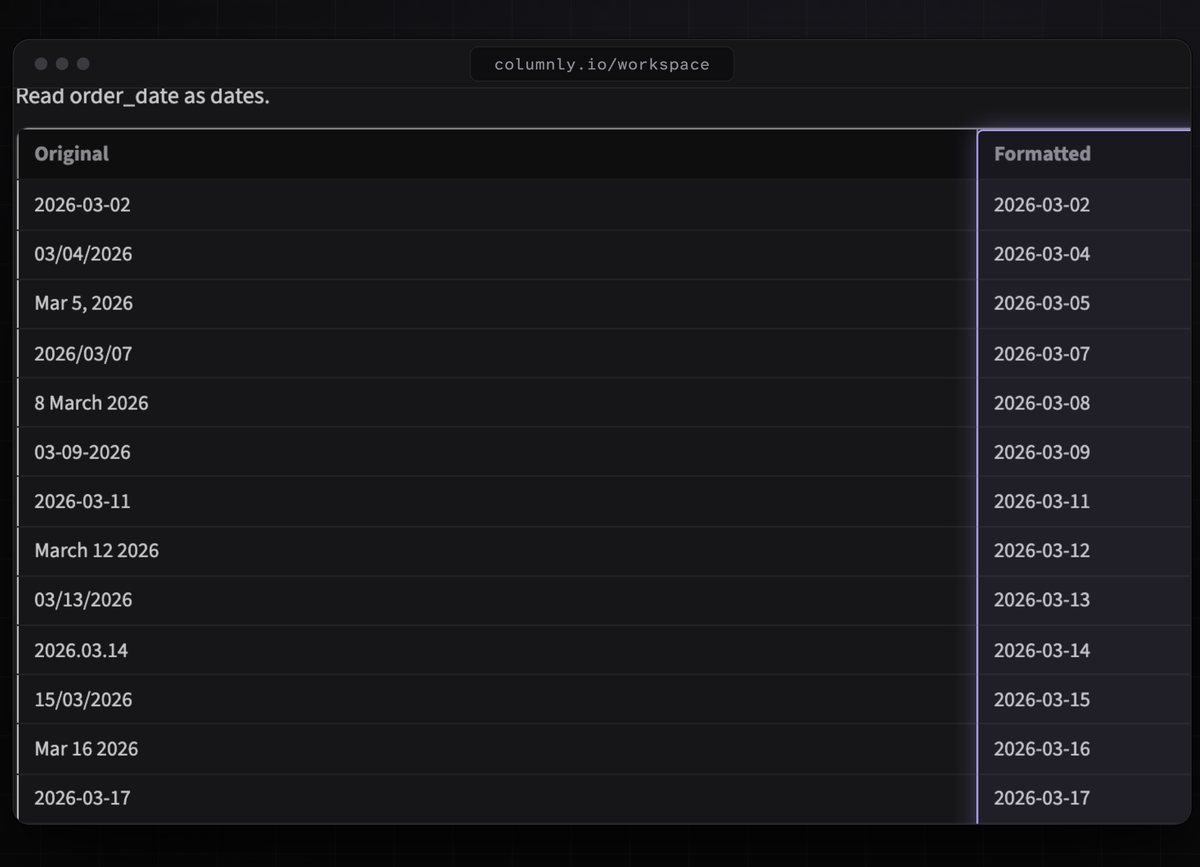
Reformat mixed columns
03/04/2026, Mar 5, 2026, 2026.03.14: one rule turns them all into one standard format.
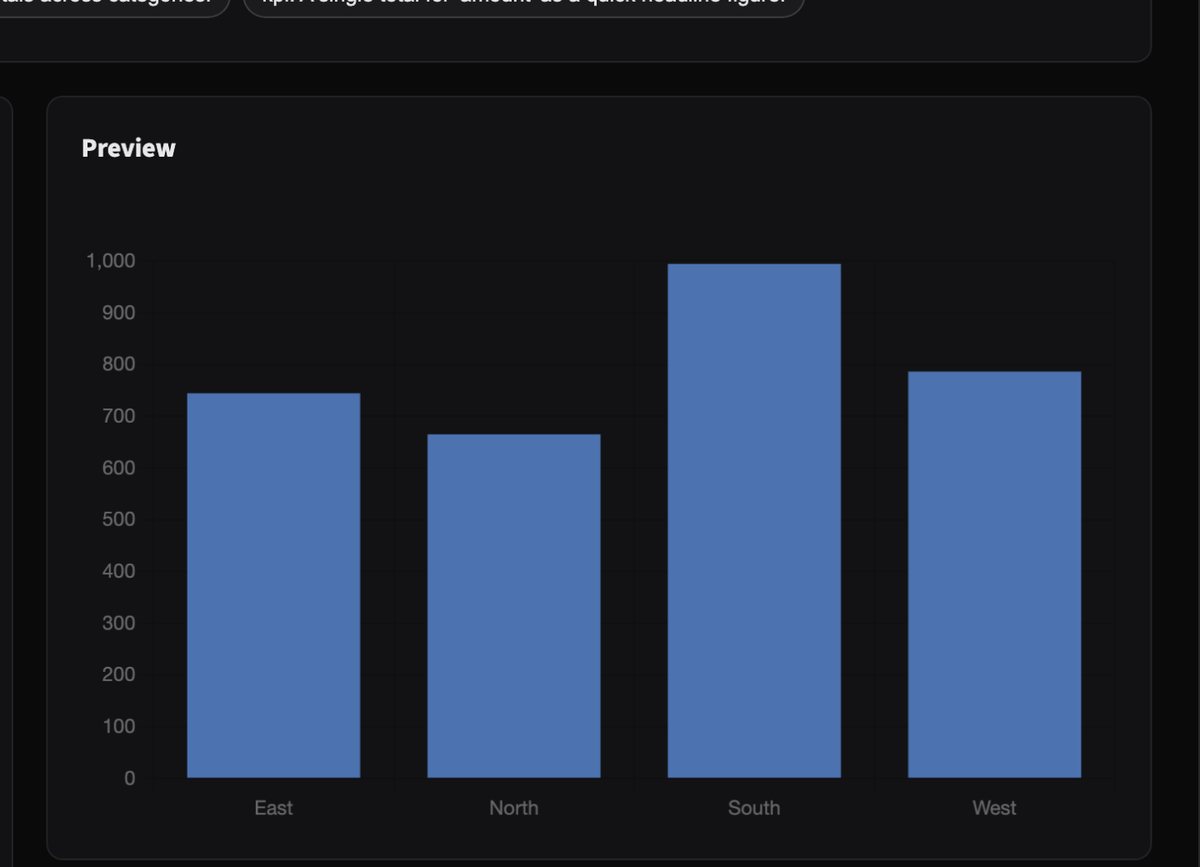
Create visualizations
Start from a suggested chart, preview it live, export as PNG, SVG or PDF.
More rules for messier data.
-
Concatenate
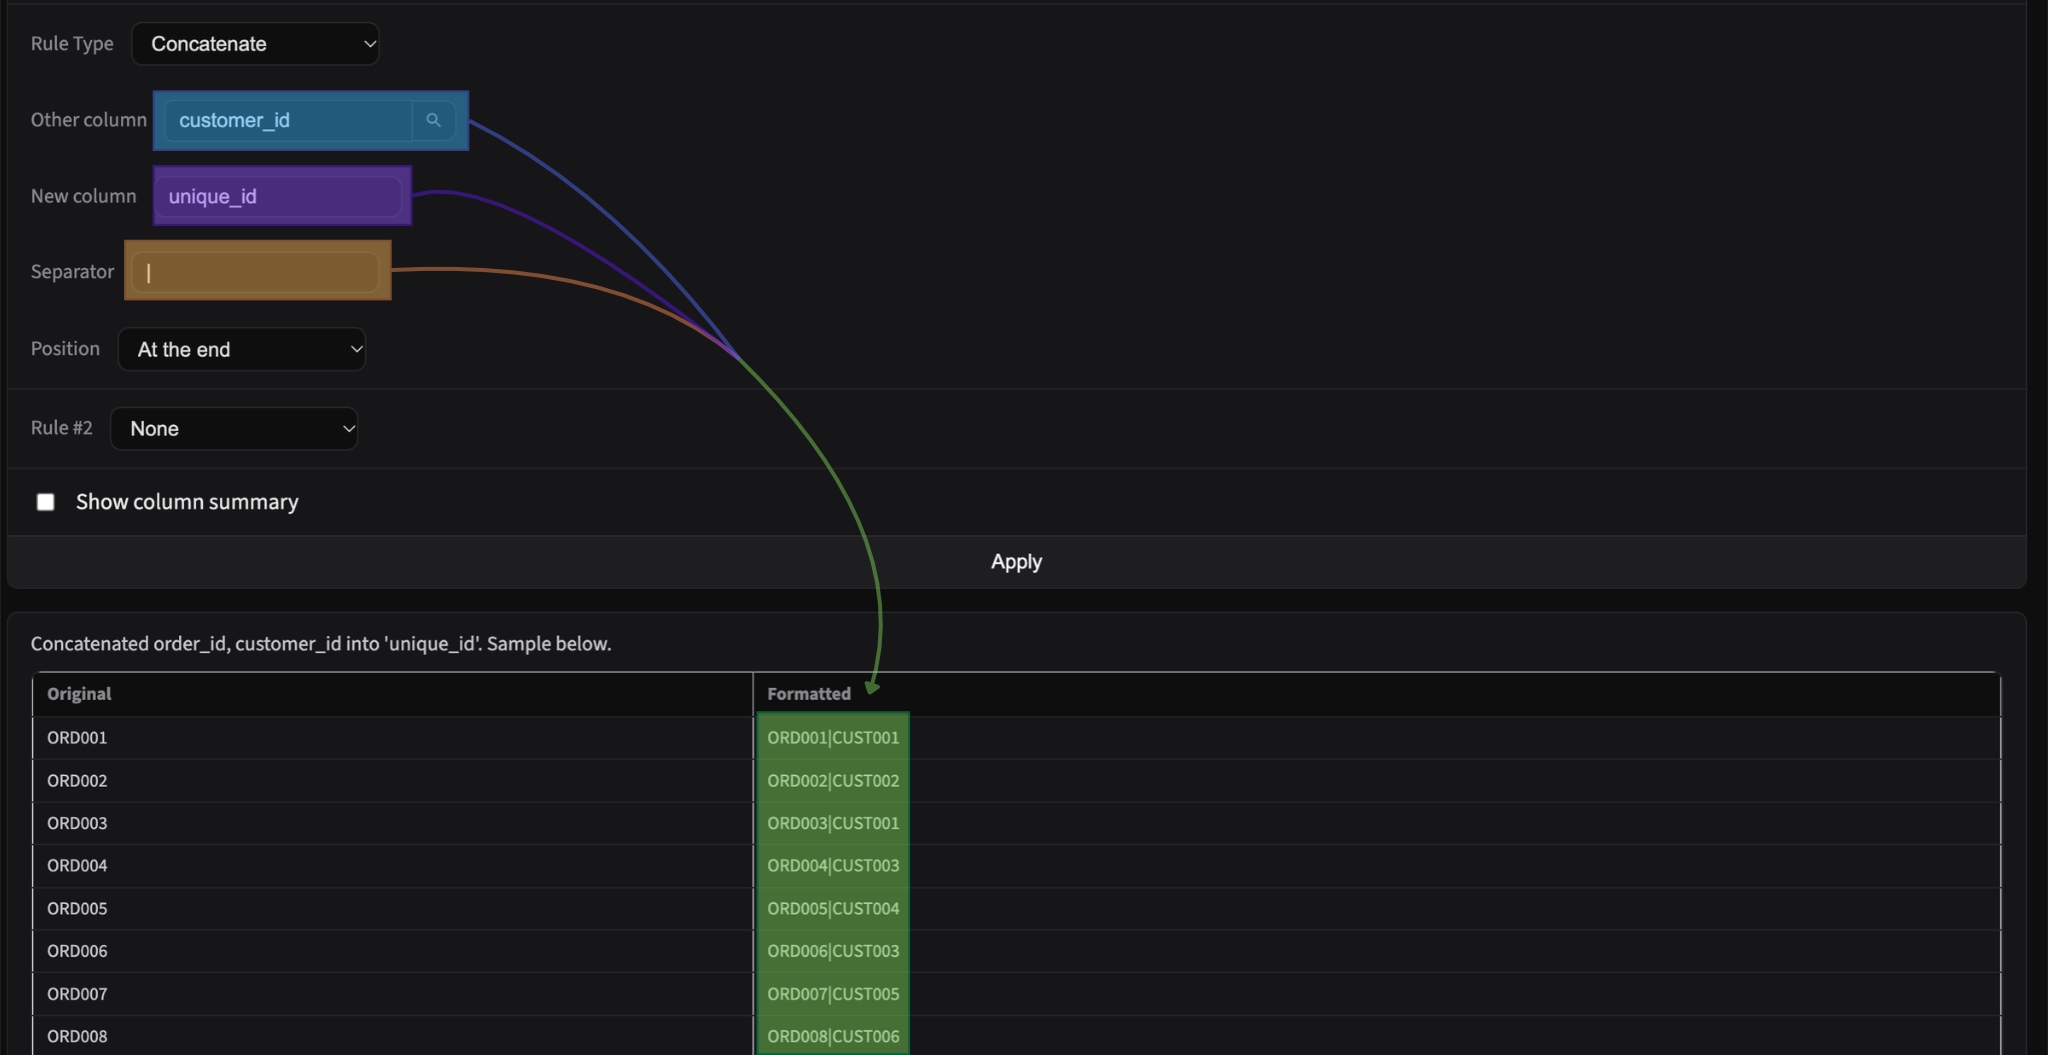
Concatenate columns together
-
Default Value
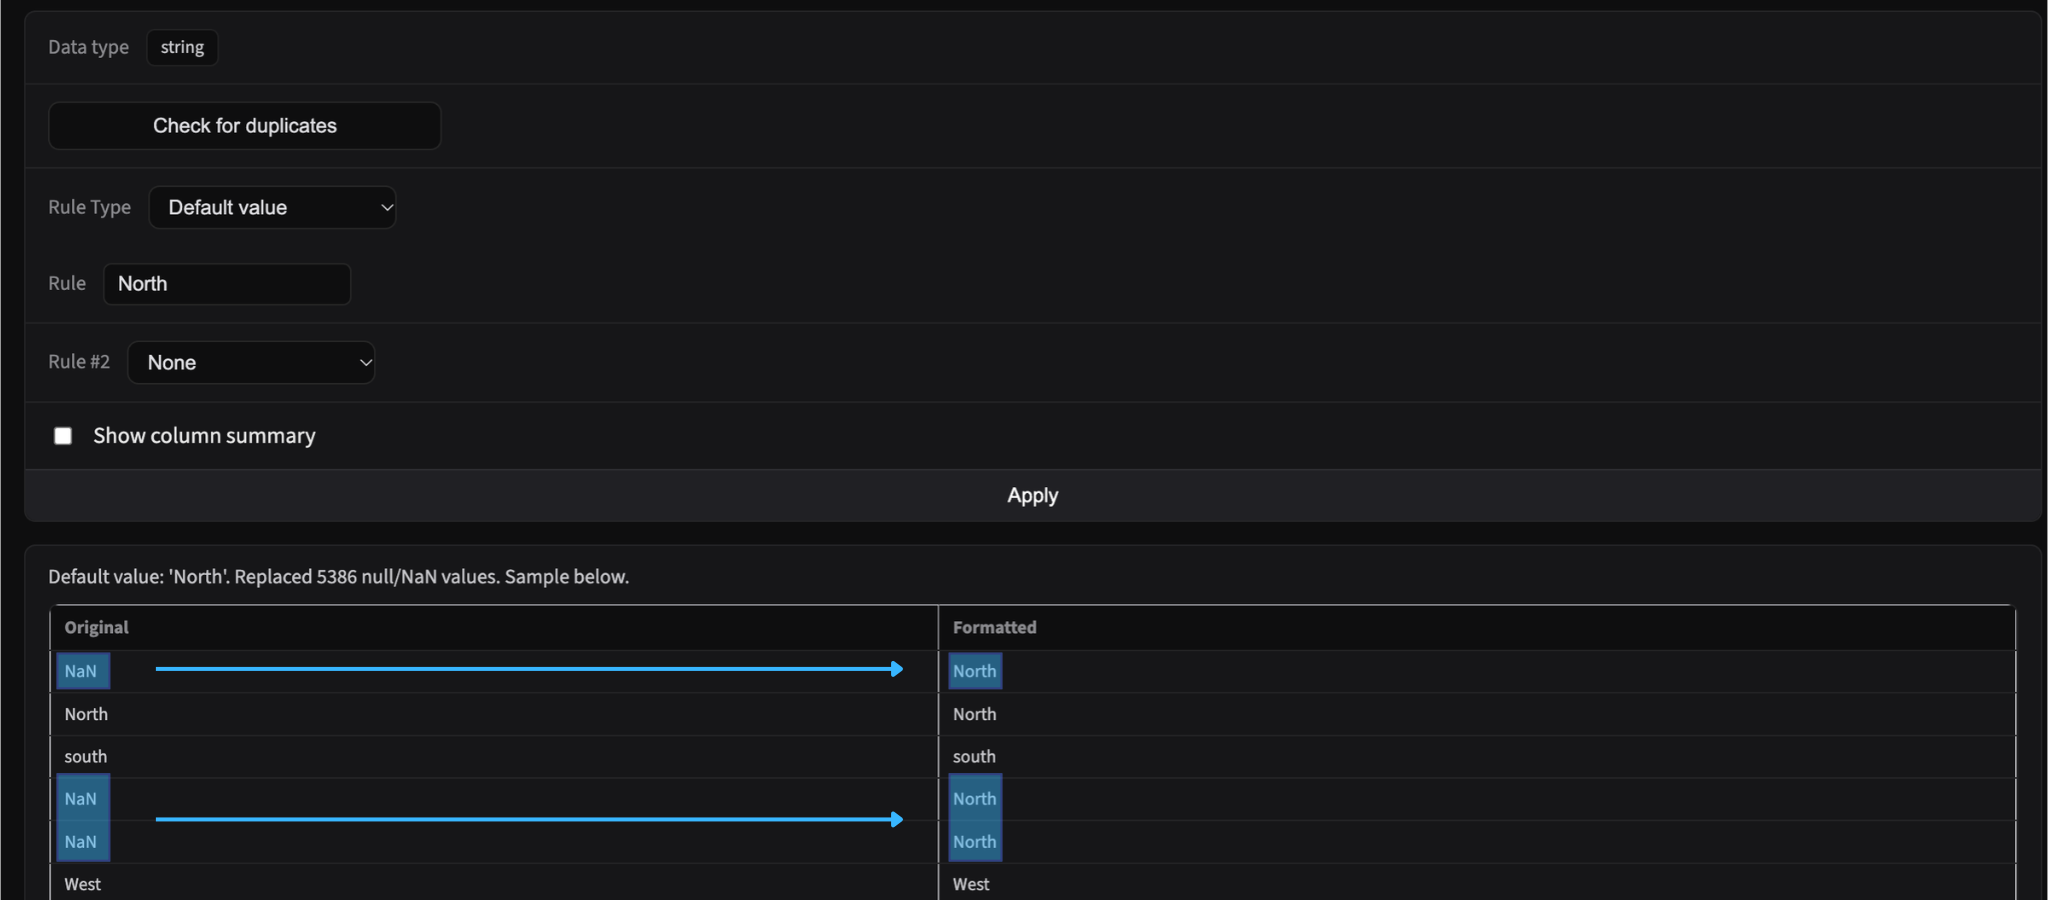
Set default values in columns
-
Split Columns
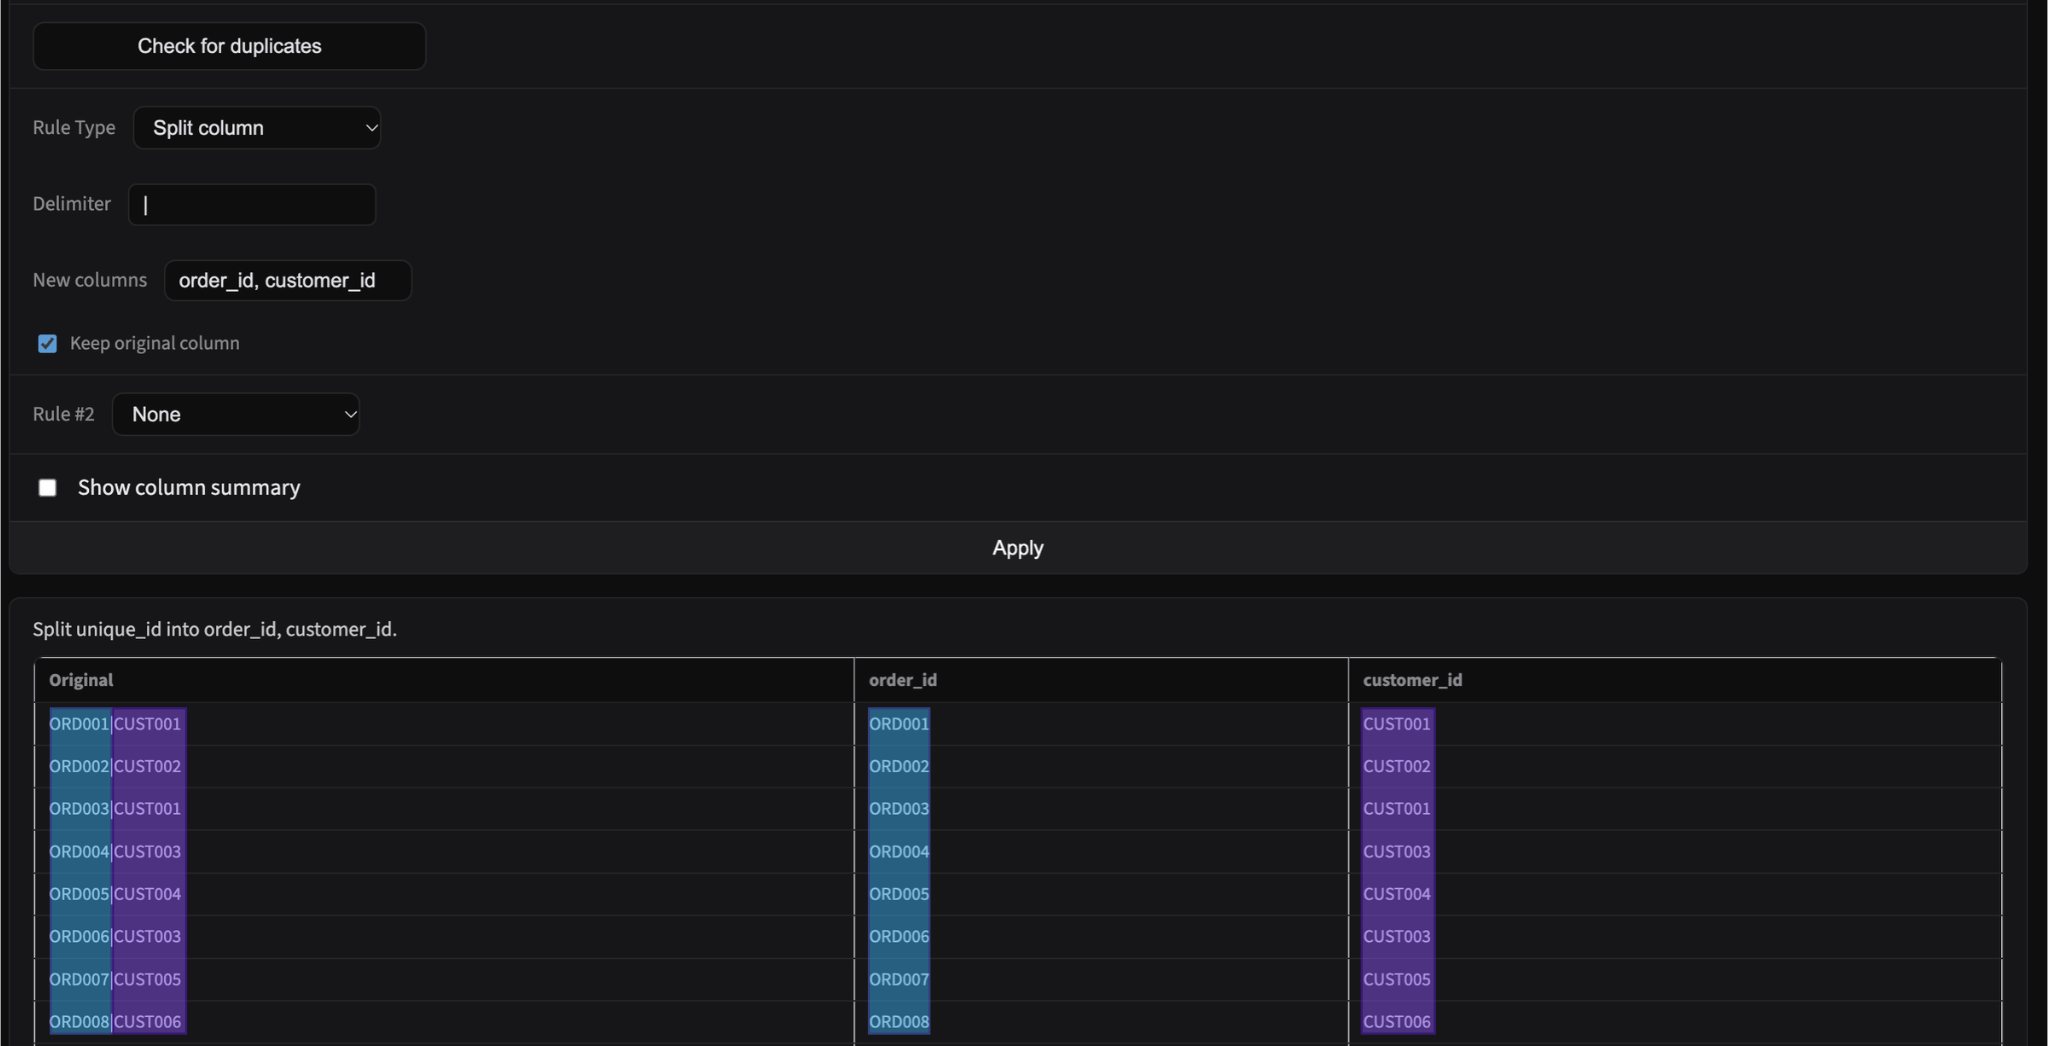
Split a column into two columns
-
Standardize Data
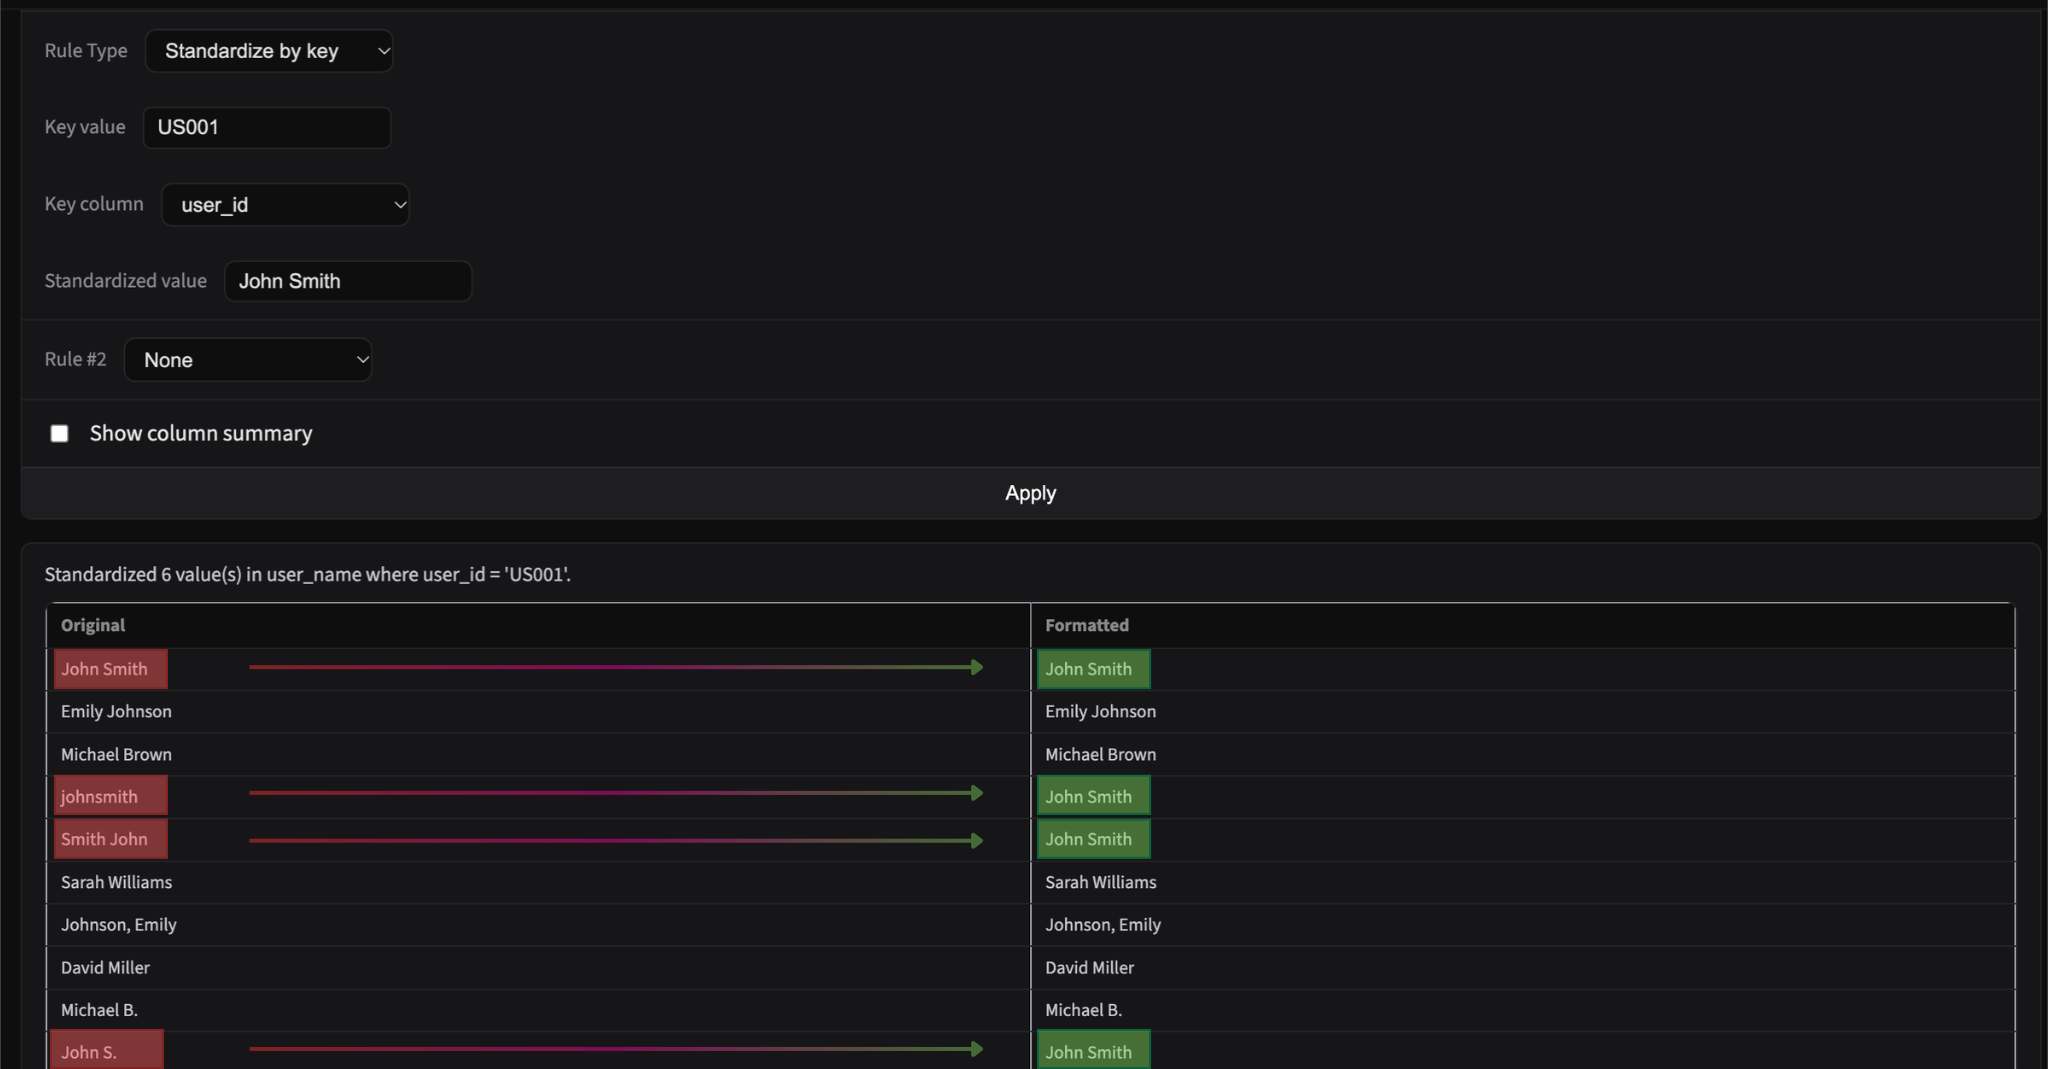
Standardize data sharing a common identifier
-
Trim Characters
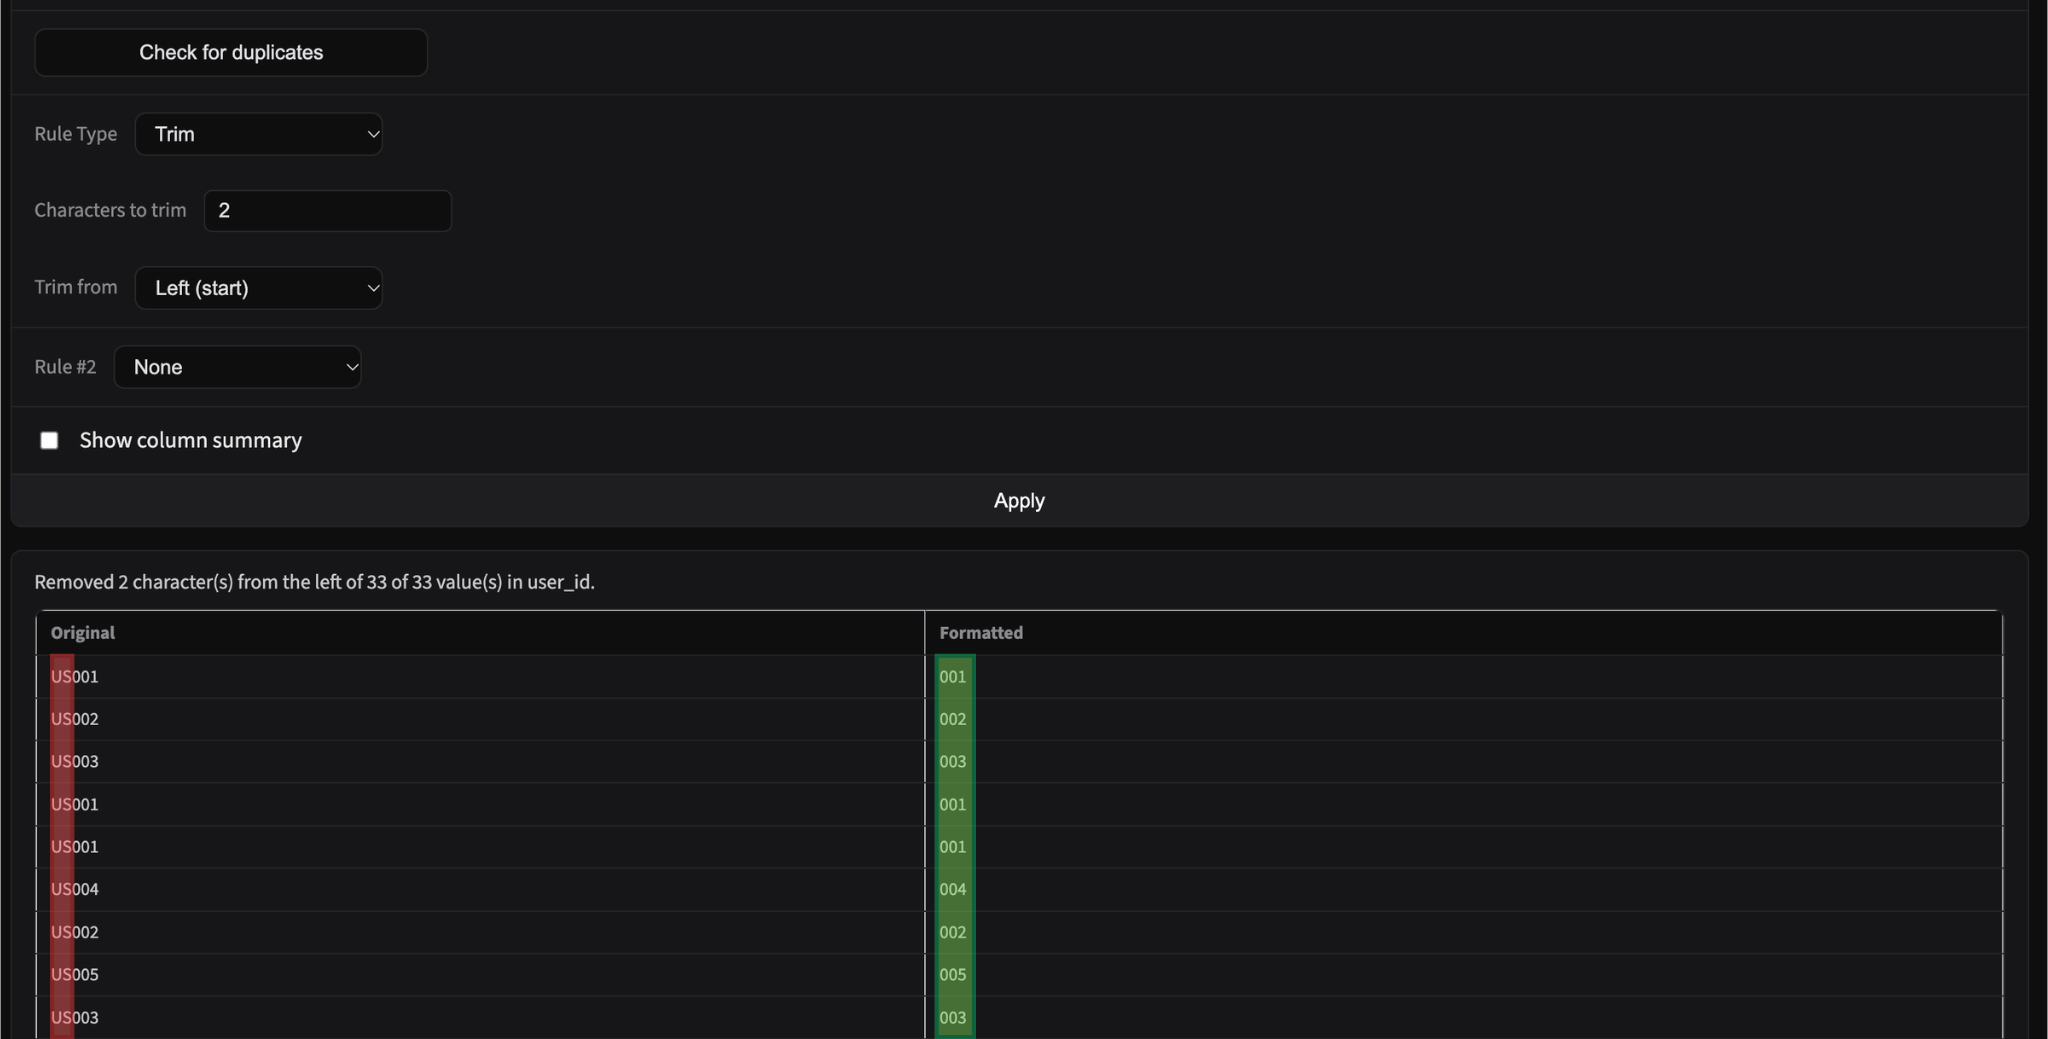
Trim characters off the left or right side of a column
Bring on multiple datasets.
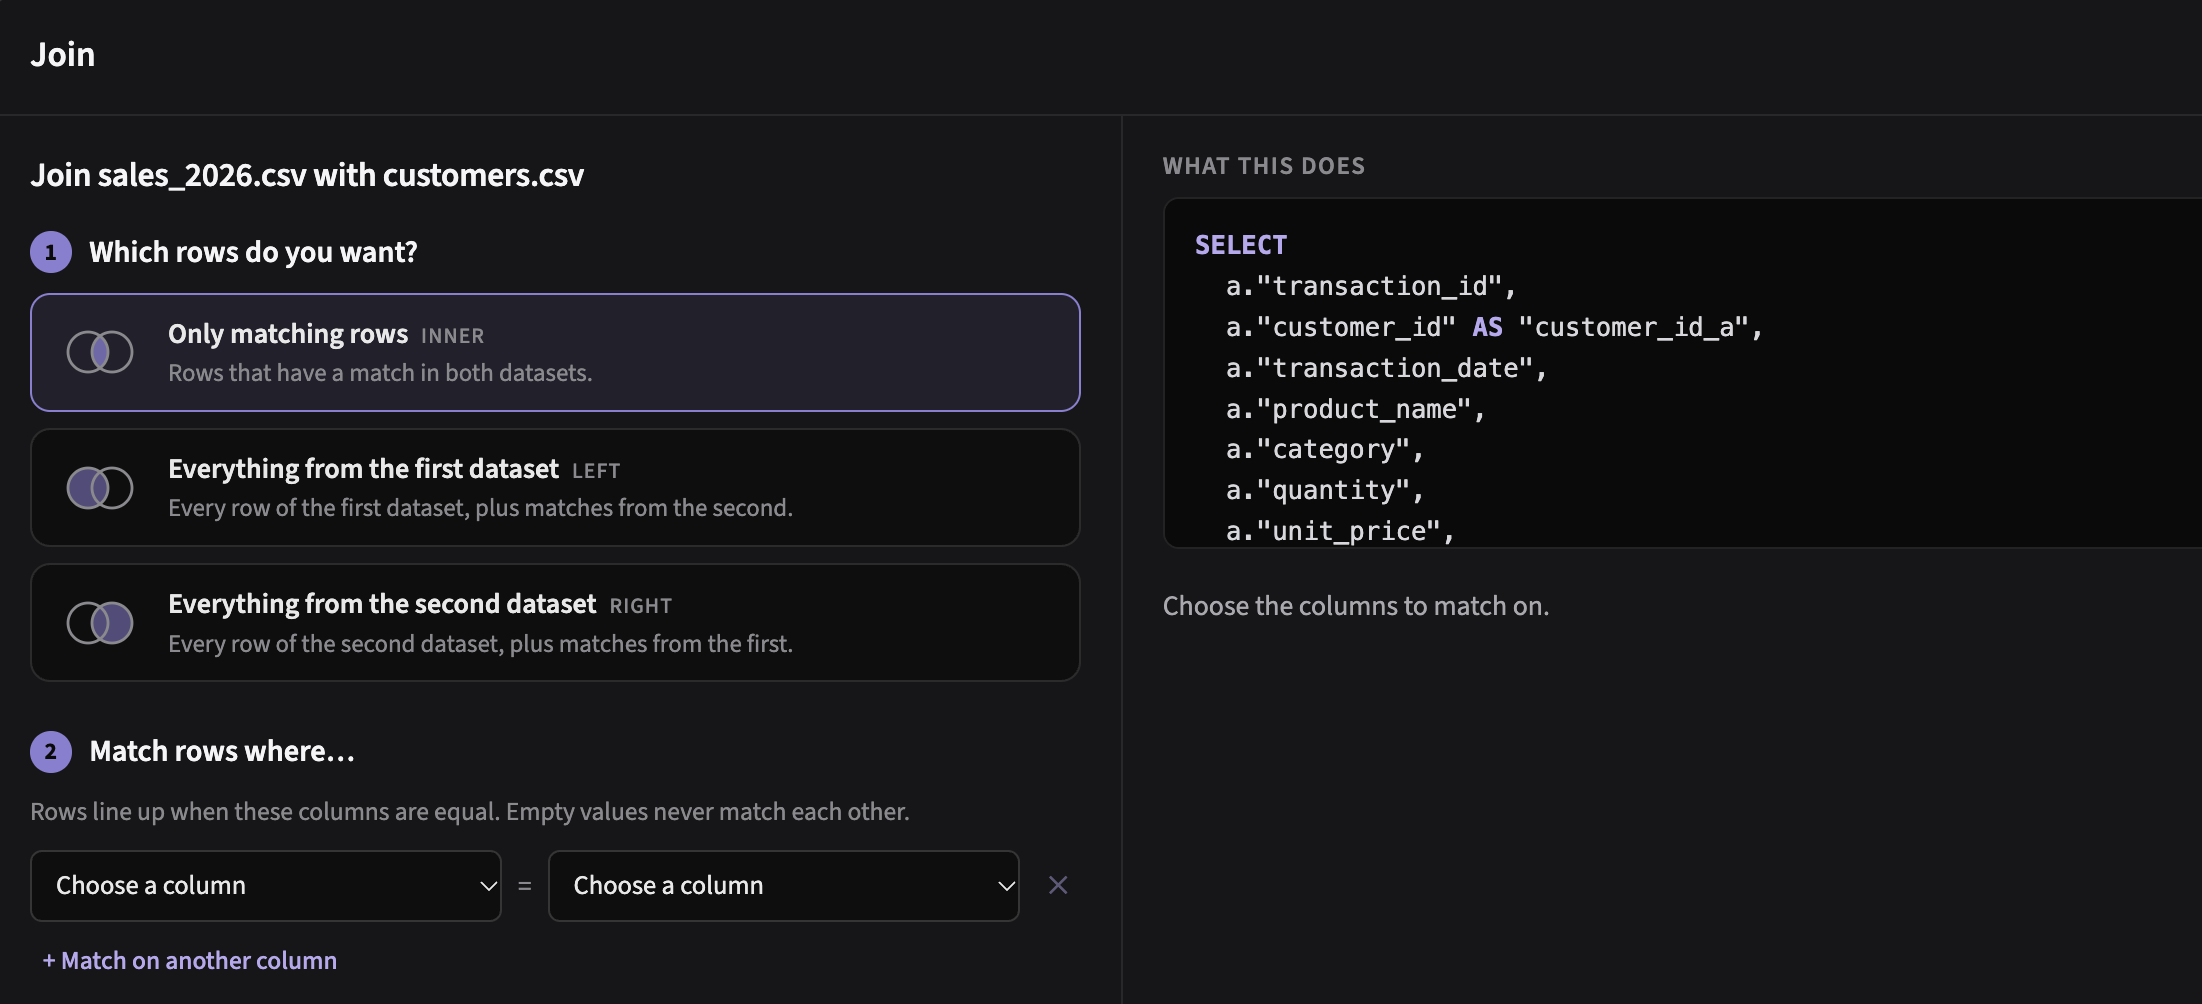
Multiple ways to join datasets
Join your datasets in a way that fits your workflow. See a live SQL preview of your join.
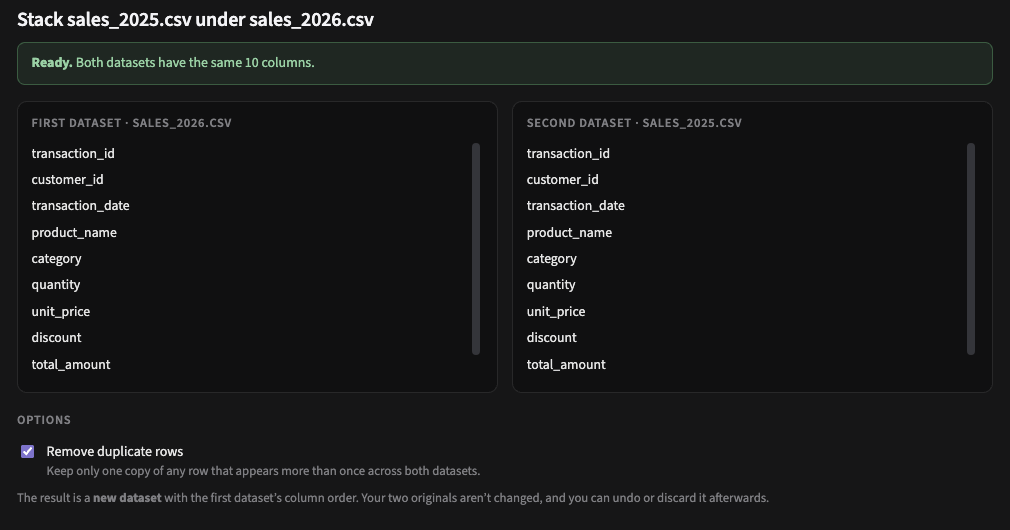
Union your datasets
Stack datasets on top of each other, and remove duplicated rows if needed.
Build it once.
Rerun it forever.
Save your steps as a workflow. Next month’s export goes in, the same clean file and chart come out.
Explore workflows
- 01Build it once.
- 02Every step, saved.
- 03Next month’s file goes in…
- 04…the same clean file and chart come out.
Priced per workflow, not per seat.
- 6 exports / month
- 1 saved workflow
- Files up to 250k rows
- All export formats
- Create visualizations
- 32 exports / month
- 4 saved workflows
- File history
- Scheduled reruns
- All export formats
- Create visualizations
- Unlimited exports
- 32 saved workflows
- File history
- Scheduled reruns
- All export formats
- Create visualizations